


Understanding and Analysing Continuous Glucose Monitoring (CGM) Reports
Published on:August 23 2024
Continuous Glucose Monitoring (CGM) is a critical tool in managing diabetes, providing real-time data on glucose levels. This article aims to guide nurses and pharmacists on how to read and analyse CGM reports effectively, enabling effective diabetes management by maximising the potential and capability of the CGM.
Key Sections of the CGM Report
The following sections provide a comprehensive overview of glucose management during the reporting period, including glucose statistics and targets, detailed metrics, time in ranges, the ambulatory glucose profile, high/low blood glucose events, and daily glucose overview.
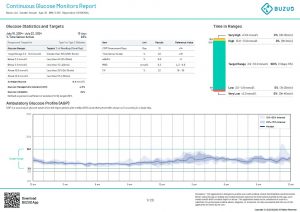
- Glucose Statistics and Targets
This section outlines the overall performance of glucose control, including the percentage of time glucose levels stayed within target ranges and the average glucose level. It highlights key targets such as maintaining glucose levels within the optimal range (3.9 – 10.0 mmol/L) and minimising occurrences of extreme values below or above this range. Understanding these statistics helps in evaluating how well glucose levels are being controlled and identifying areas that may require adjustment.- Report Period: July 10, 2024 – July 22, 2024 (13 days)
- Time Sensor Active: 93%
- The key targets for glucose ranges are:
- Target Range (3.9 – 10.0 mmol/L): >70%
- Below 3.9 mmol/L: <4%
- Below 3.0 mmol/L: <1%
- Above 10.0 mmol/L: <25%
- Above 13.9 mmol/L: <5%
- Average Glucose: 6.3 mmol/L
Glucose Management Indicator (GMI): 4.5%
Glucose Variability: 22% (Target ≤ 36%)
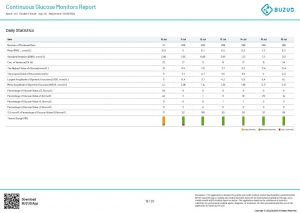
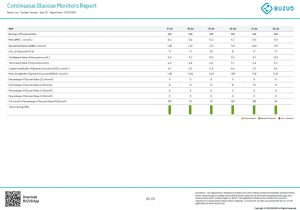
- Detailed Metrics
Here, the report provides specific measurements including the number of days the sensor was active, estimated HbA1c levels, mean blood glucose, and glucose variability. These metrics are crucial for assessing long-term glucose control and identifying patterns that can impact overall diabetes management. For instance, the estimated HbA1c gives an indication of average glucose levels over a longer period, which is a key marker in diabetes management.- CGM Assessment Days: 13 (Target: >14)
- Time Sensor Active: 93% (Target: >70%)
- Estimated HbA1c (eHbA1c): 6.6% (Target: <7%)
- Mean Blood Glucose (MBG): 6.3 mmol/L (Target: 4.3 – 6.6 mmol/L)
- Coefficient of Variation (CV): 22% (Target: 18 – 36%)
- Time in Ranges
This section breaks down the percentage of time spent in various glucose ranges, including very high, high, target, low, and very low ranges. Monitoring this helps in understanding how often glucose levels deviate from the desired range and can guide adjustments in treatment or lifestyle to improve overall glucose control.- Very High (>13.9 mmol/L): 0% (0h 30min)
- High (10.0 – 13.9 mmol/L): 0% (5h 5min)
- Target Range (3.9 – 10.0 mmol/L): 100% (11days 17h)
- Low (3.0 – 3.9 mmol/L): 0% (1h 30min)
- Very Low (<3.0 mmol/L): 0% (0h 40min)
- Ambulatory Glucose Profile (AGP) The AGP provides a visual summary of glucose values over the reporting period, displayed as if they occurred in a single day, offering a snapshot of glucose patterns and fluctuations. This visualisation helps in identifying trends and patterns, making it easier to pinpoint times of day when glucose levels may be problematic.
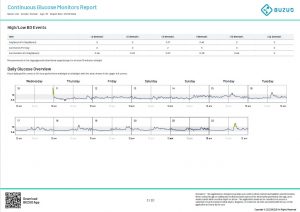
- High/Low Blood Glucose Events
This section records occurrences of glucose levels that are too high or too low. Tracking these events is important for addressing episodes of hyperglycemia or hypoglycemia, which can affect overall health and diabetes management. Understanding the frequency and duration of these events can help in fine-tuning treatment plans.- High Glucose Events (>13.9 mmol/L): 0 hours/day
- Low Glucose Events (<3.9 mmol/L): 0.17 hours/day
- Daily Glucose Overview
The daily glucose profiles provide a detailed view of glucose levels over each 24-hour period. This detailed breakdown helps in analysing daily glucose fluctuations and understanding how factors such as meals, physical activity, and medications impact glucose levels.
Steps to Read and Analyse the CGM Report
Understanding and accurately interpreting your Continuous Glucose Monitoring (CGM) report is crucial for effectively managing diabetes, as it helps you identify patterns, adjust treatment plans, and make informed decisions to maintain optimal glucose control and overall health.
- Review the Glucose Statistics
- Check the percentage of time the glucose levels were within the target range.
- Note any significant deviations from the target ranges.
- Evaluate Detailed Metrics
- Confirm the sensor’s active time to ensure the data’s reliability.
- Assess the estimated HbA1c and mean blood glucose levels.
- Analyze Time in Ranges
- Examine the time spent in each glucose range to identify patterns or concerns.
- Focus on any periods of hyperglycemia or hypoglycemia.
- Interpret the Ambulatory Glucose Profile (AGP)
- Use the AGP to visualise daily glucose trends and variability.
- Identify consistent patterns or outliers.
- Identify High/Low Blood Glucose Events
- Note the frequency and duration of high and low glucose events.
- Use this information to adjust treatment plans if necessary.
- Examine Daily Glucose Overviews
- Look for trends in daily glucose fluctuations.
- Consider factors such as meals, exercise, and insulin doses.
Key Statistics to Focus On
- Time in Target Range (3.9 – 10.0 mmol/L)
- Example: If a patient maintains glucose levels within this range for more than 70% of the time, it indicates good glucose control. For instance, in the report, the patient achieved 100% time in the target range, which is excellent.
- Average Glucose Level
- Example: An average glucose level of 6.3 mmol/L, as seen in the report, suggests stable glucose control. This helps in assessing overall glucose management effectiveness.
- Glucose Variability (Coefficient of Variation)
- Example: A variability of 22% (target ≤ 36%) indicates stable glucose levels with minimal fluctuations. Lower variability reduces the risk of complications.
- Estimated HbA1c (eHbA1c)
- Example: An eHbA1c of 6.6% (target <7%) shows good long-term glucose control. This metric correlates with average glucose levels over a longer period.
- High/Low Blood Glucose Events
- Example: The report shows 0 hours/day of high glucose events (>13.9 mmol/L) and 0.17 hours/day of low glucose events (<3.9 mmol/L). Minimising these events is crucial for preventing acute complications.
Detailed Metrics
- Time Sensor Active
- Example: The sensor was active 93% of the time (target >70%), ensuring reliable data collection for accurate glucose monitoring.
- Mean Blood Glucose (MBG)
- Example: An MBG of 6.3 mmol/L (target 4.3 – 6.6 mmol/L) aligns well with the target range, indicating effective daily glucose management.
Time in Ranges
- Very High (>13.9 mmol/L)
- Example: 0% time spent in this range indicates no episodes of severe hyperglycemia, which is ideal.
- High (10.0 – 13.9 mmol/L)
- Example: 0% time in this range suggests excellent control, avoiding moderate hyperglycemia.
- Low (3.0 – 3.9 mmol/L)
- Example: 0% time in this range indicates no episodes of moderate hypoglycemia, which is beneficial for patient safety.
- Very Low (<3.0 mmol/L)
- Example: 0% time in this range shows no severe hypoglycemia, which is critical for avoiding dangerous lows.
Ambulatory Glucose Profile (AGP)
- Example: The AGP visualises glucose patterns over the reporting period, helping to identify trends and times of day when glucose levels may be problematic. This can guide adjustments in treatment or lifestyle.
High/Low Blood Glucose Events
- Example: Tracking these events helps in fine-tuning treatment plans. For instance, the report shows minimal low glucose events, indicating effective hypoglycemia management.
Daily Glucose Overview
- Example: Analysing daily glucose profiles helps understand how meals, physical activity, and medications impact glucose levels. This detailed breakdown can guide personalised treatment adjustments.
By understanding and effectively analysing CGM reports, nurses and pharmacists can play a crucial role in improving diabetes care and patient outcomes.
Practical Tips for Nurses and Pharmacists
- Patient Education: Educate patients on the importance of maintaining glucose levels within the target range.
- Treatment Adjustments: Use the data to make informed decisions about insulin dosing and dietary changes.
- Regular Monitoring: Encourage consistent use of the CGM to track glucose levels accurately.
- Collaboration: Work closely with patients and other healthcare providers to optimise diabetes management plans.
Understanding and Analysing Continuous Glucose Monitoring (CGM) Reports
Related articles: